Peaks in next token distributions
Introduction
On October 12th, @doomslide from Twitter posted this image:
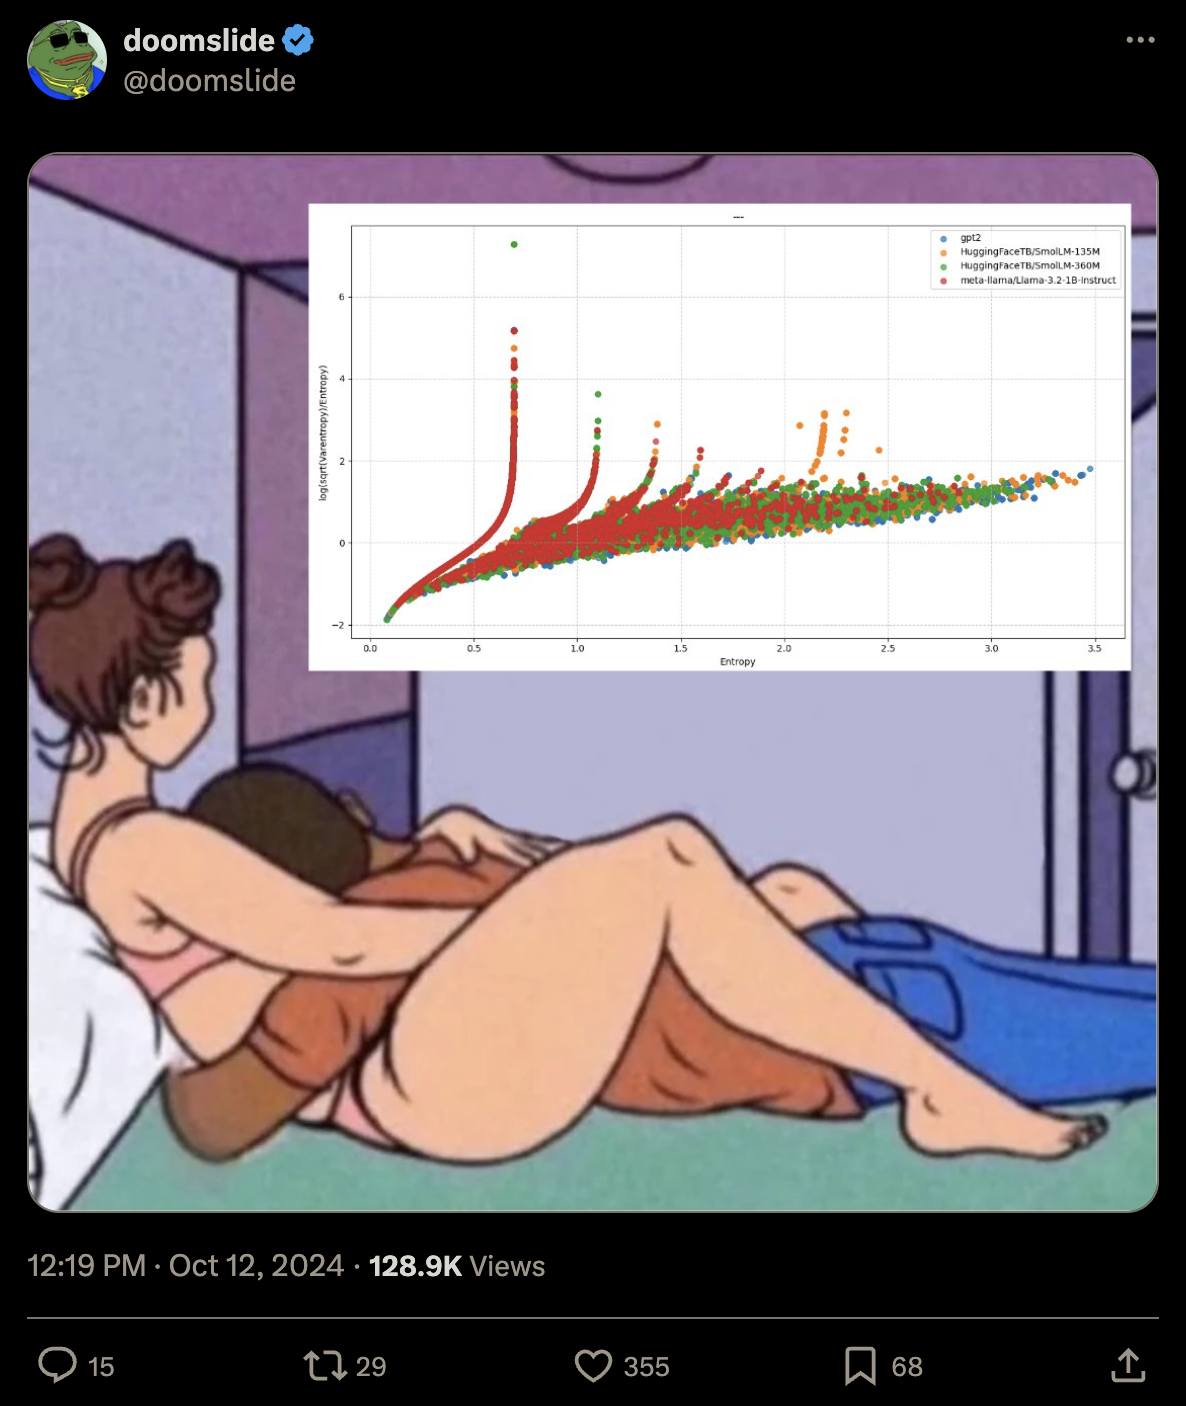
It looks like a scaling curve of some sort with smooth deviations that are at the same locations for all language models. This seems surprising - why would models with different tokenizers of completely different sizes converge in this way?
The figure plots entropy against . Given some probability over discrete outcomes (for example, probabilities of the next token in a language model), entropy is the negative mean of the log likelihood and quantifies disorder in the distribution:
If entropy is high, that means that, on average, we are surprised by any outcome that we see.
Then, varentropy is the variance of the log likelihood:
Intuitively, varentropy will be high if we can sample both high likelihood and low likelihood tokens. Note that we subtract the mean of the distribution by adding entropy because entropy is the negative mean.
These quantities are the basis of entropix, an autoregressive language model sampler by @doomslide and @_xjdr that's been making the rounds. The theory behind the sampler assumes that entropy and varentropy can vary independently and fall into four quadrants:
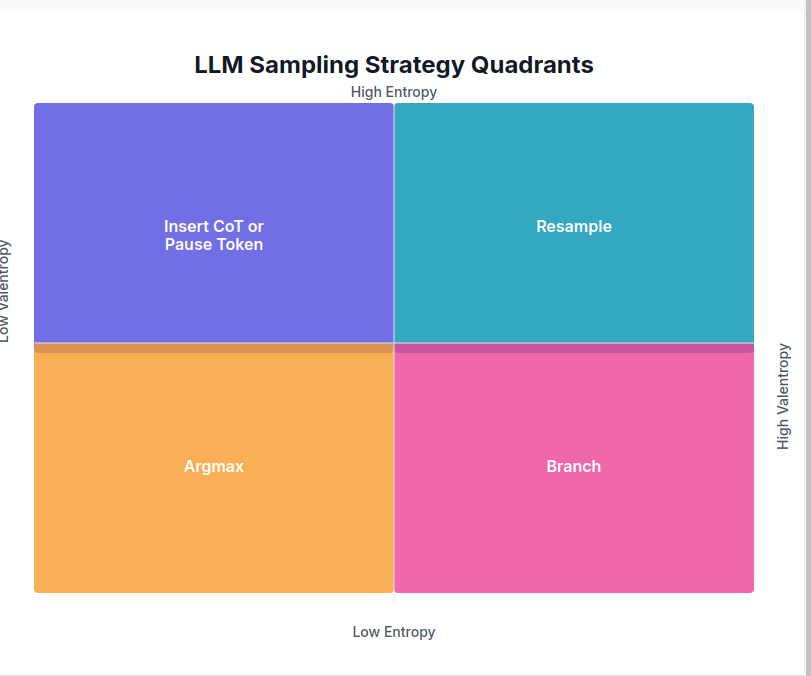
The chart classifies the current situation (how certain is the model? how certain will it be?) and dictates how the sampler should proceed. The full details are outside the scope of the post and can be read in the repo.
But why would entropy and varentropy scale together in a predictable way and trade off continuously along one dimension? It seems like a mystery! Shortly after being posted, the image was shared multiple times on Twitter and got some people convinced entropix could be AGI.
Model
Some people volunteered the explanation that the lines are caused by a small number of outcomes with probabilities very close to each other. This would indeed cause points with low varentropy and the highest entropy possible, with multiple points for each possible number of outcomes, and varying the distribution slightly would provide a continuum of lower entropies and higher varentropies, producing lines probability distributions:
=
= * 0.01 +
= /
=
= -
=
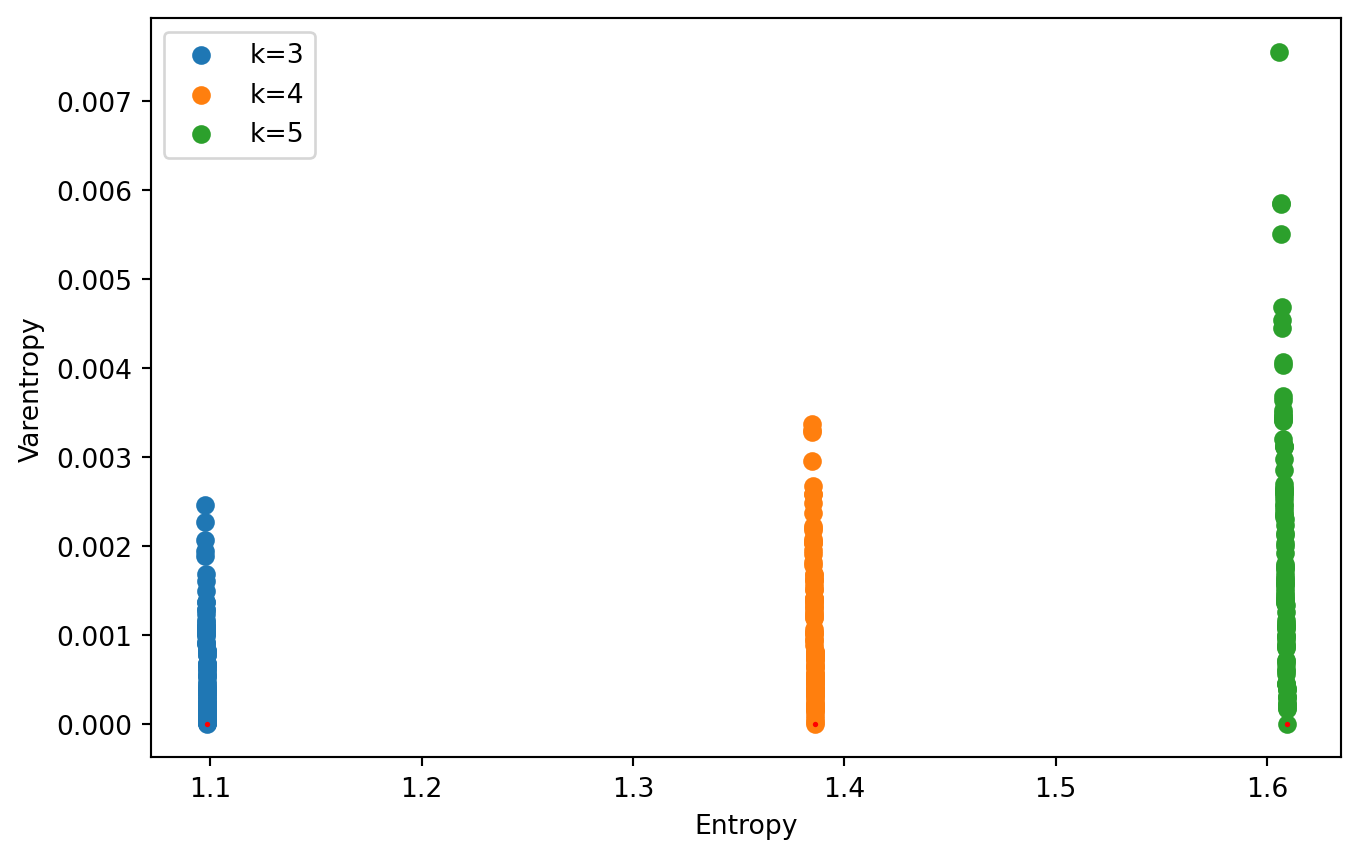
These are the special cases that are likely the lines seen on the graph.
We can plot all possible distributions (or a random subset) for comparison:
= 5
=
= /
= -
=
=
=
= /
=
= -
=
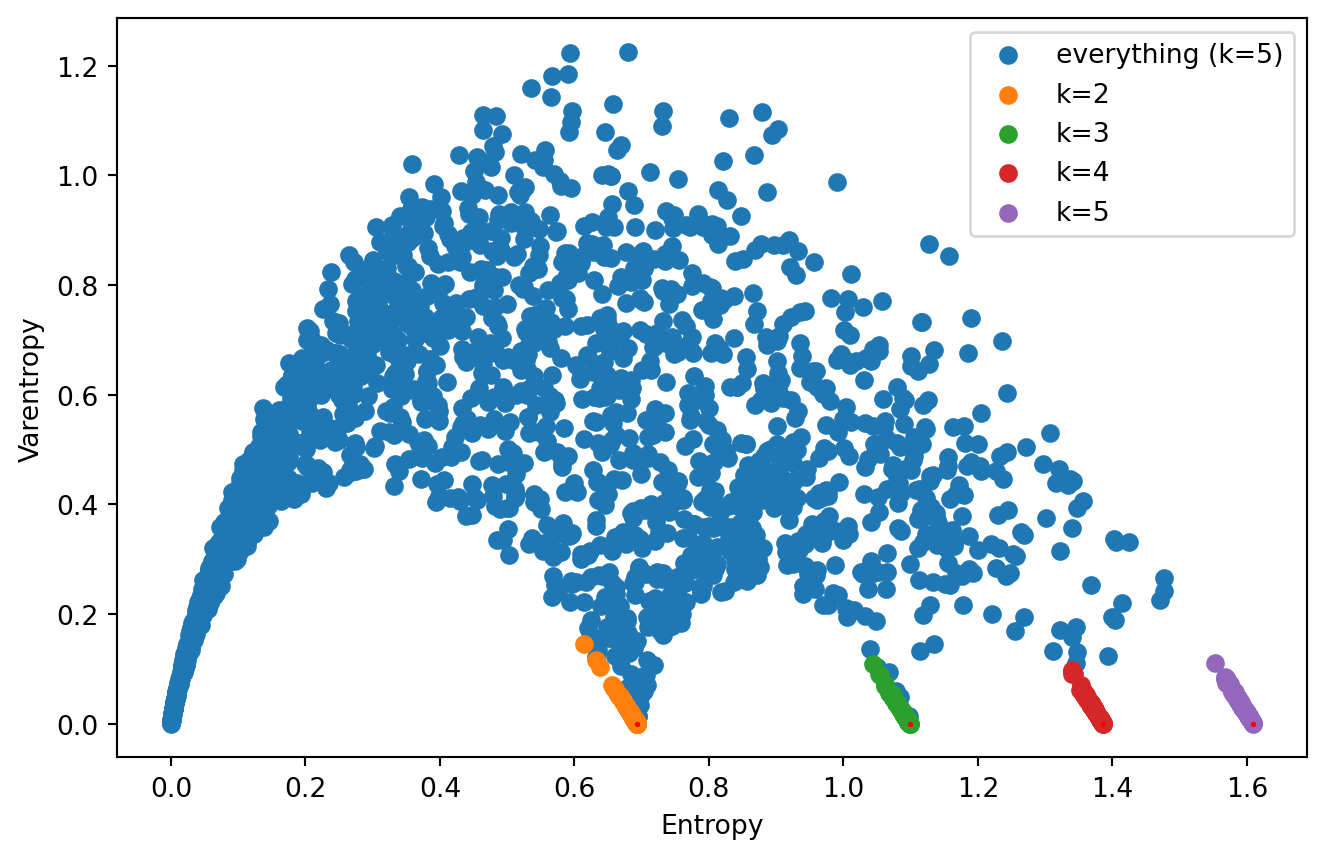
We can see that these lines are actually just part of a weirdly shaped k-legged object. This is all from random numbers, not language models. Is it possible to explain the observed scaling law using this?
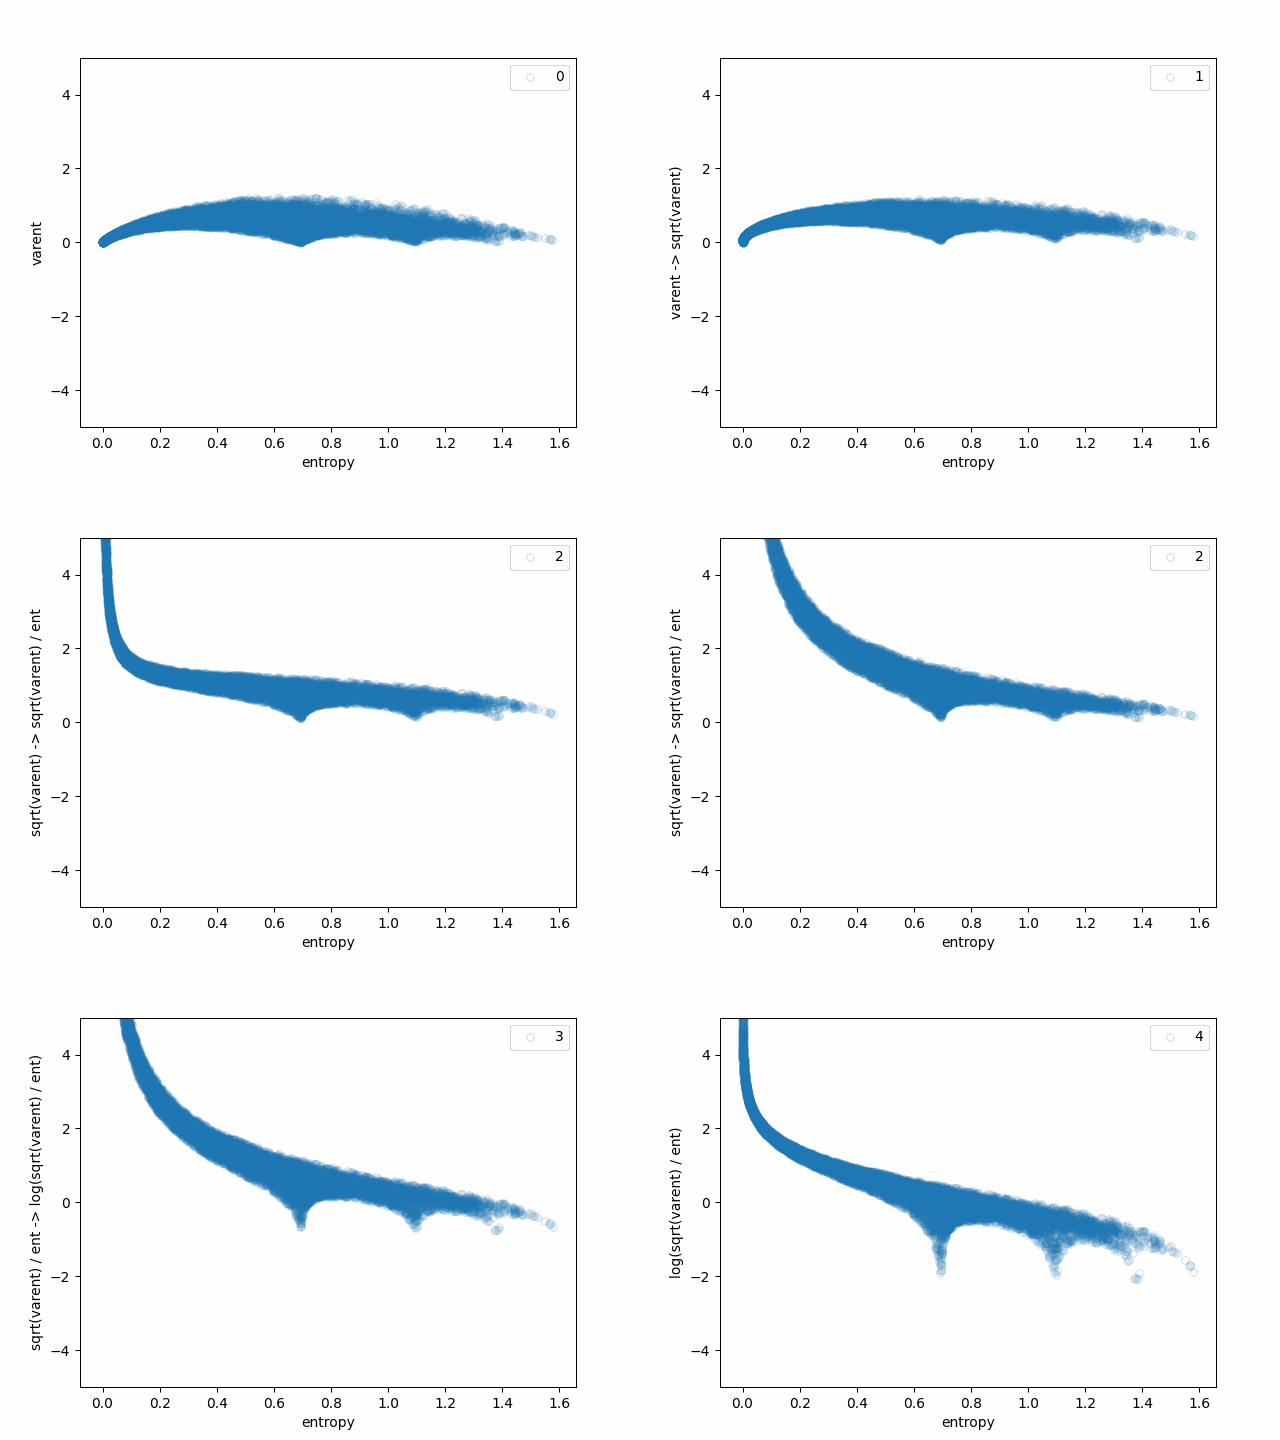
We can see how each of the steps affects the original bell-like shape:
- varent -> sqrt(varent) makes the angles for the "special points" somewhat sharper.
- sqrt(varent) -> sqrt(varent)/ent makes the plot look like a loss plot and makes the "special points" look more important. This is because it divides by the x-axis, essentially multiplying by a hyperbola.
- sqrt(varent)/ent -> log(sqrt(varent)/ent) makes the singularity near x=0 look less sharp and makes the "special points" and lines meeting them stand out even more.
We can conclude that the lines in the original plot appear when there is a small number of almost-equally-likely possibilities and that the scaling-like behavior is an artifact of the transformation applied to the y-axis.
The actual image looks slightly different from the model with all probabilities assigned equal weight:
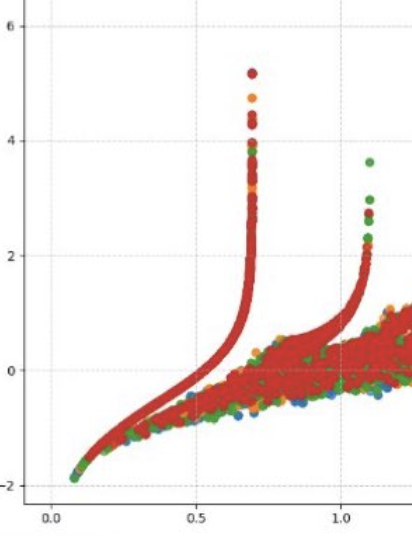
This means that the lines around special points we observed before have higher weight than would expected. This would make sense for language models: in text, the model is likely to guess when it is presented with a multiple choice task or has to predict a digit. Spreading probability almost-equally would be a good way to maximize likelihood and it's possible some circuit enables that behavior specifically, like with confidence neurons.
Closed form
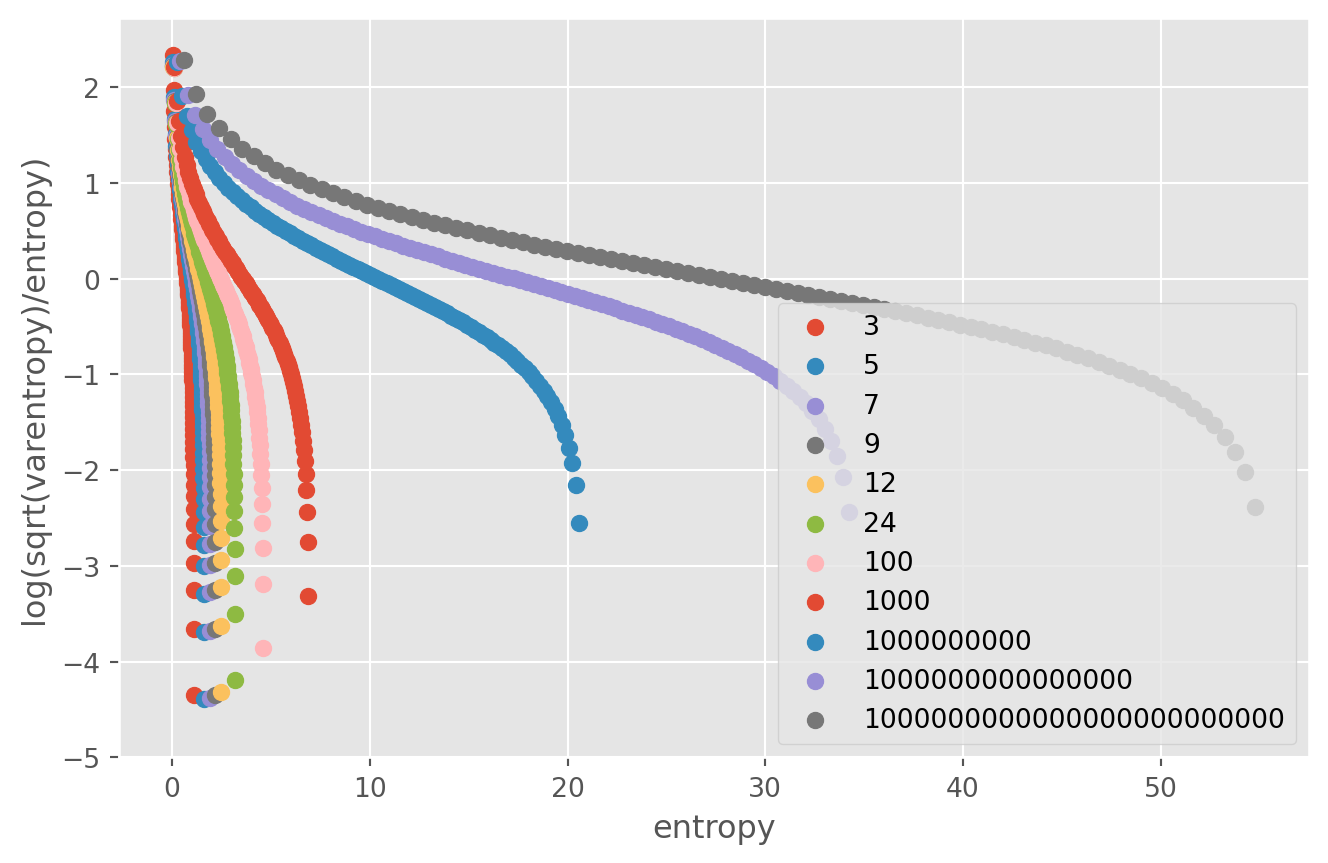
Can we find the lines around "special points" without sampling small perturbations? Yes! It turns out we can get the same Pareto frontier of entropy-varentropy by continuously modifying the probability of a single option and keeping all others uniform, a sort of spike-and-slab distribution. We don't need to store all probabilities and can use high-precision arithmetic to take care of the unstable logs. This approach scales up to massive amounts of options:
. = 100
=
=
=
=
=
= / + *
= /
=
=
=
= -
=
=
=
=
