mandelbub: imaginary exponent Mandelbrot set
In late November 2024, I saw this video:
It looks at the Mandelbrot set with exponents other than 2 and constructs a fractal in which the coordinate is the exponent used in the Mandelbrot set. I was looking for a new cover image for my blog at the time and decided to use the complex-exponent Mandelbrot set, but with a twist: I'd render a cloudy histogram of all the trajectories of points that escape the Mandelbrot set, a technique known as the Buddhabrot.
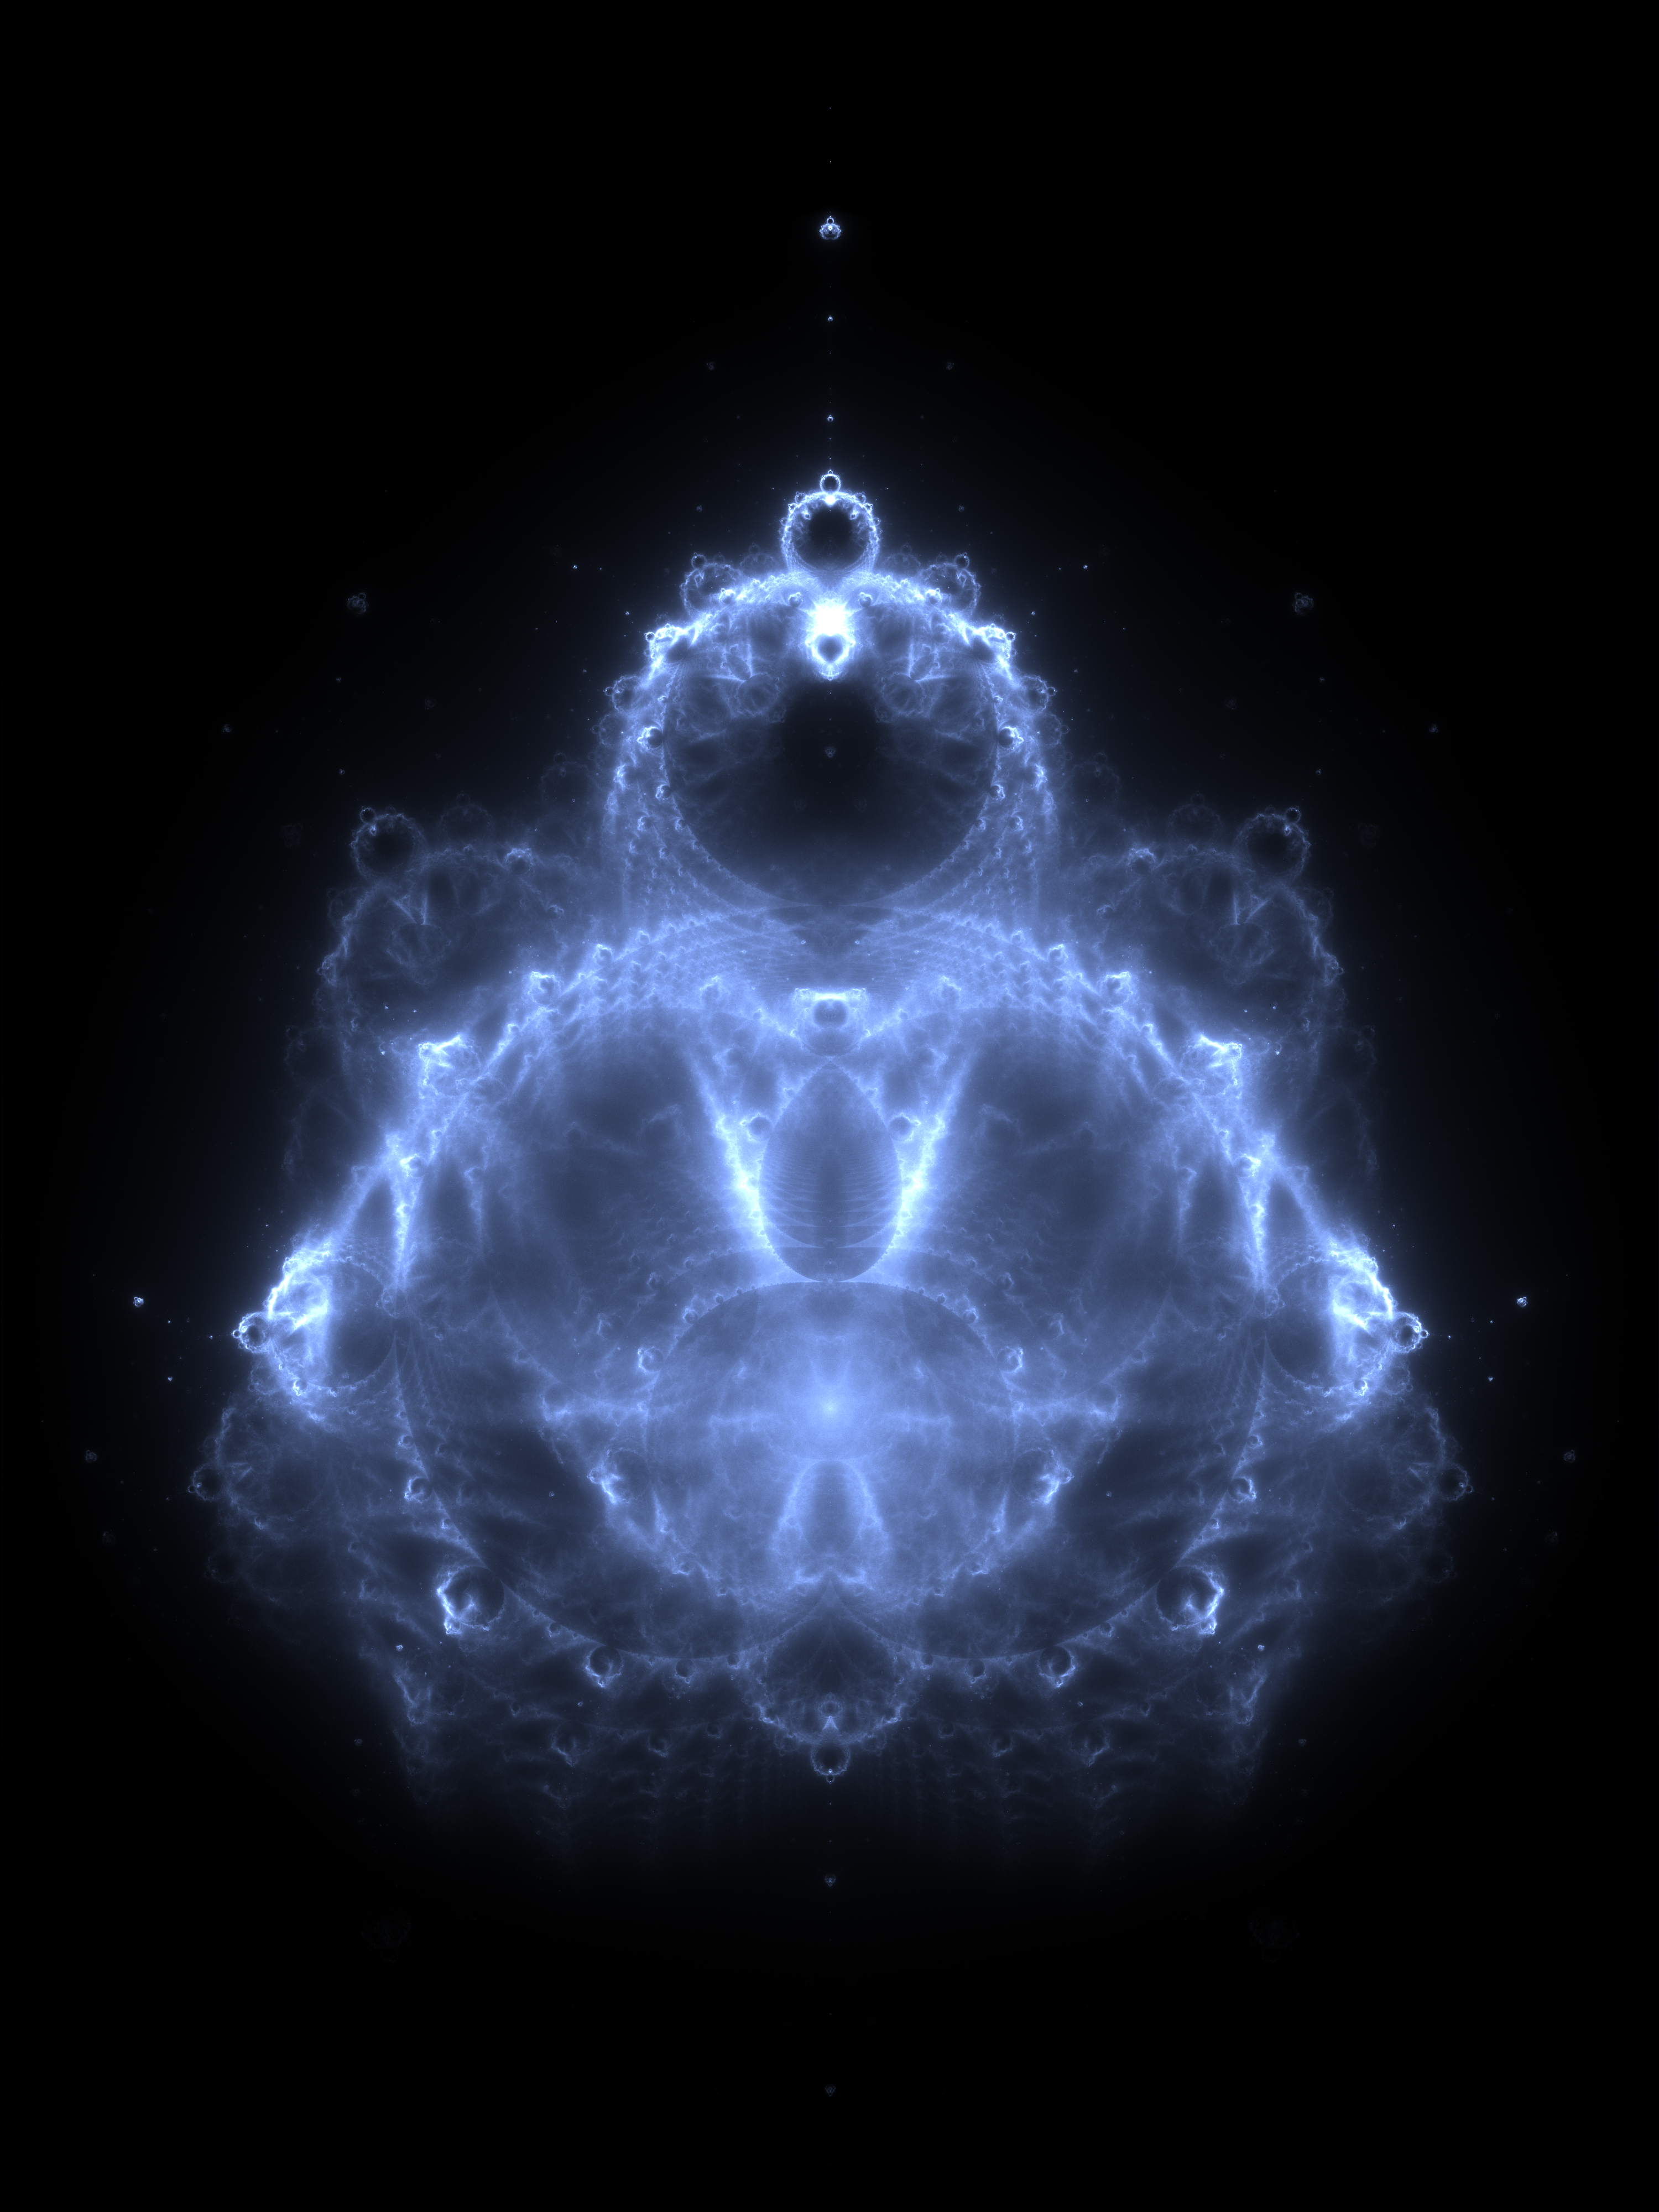
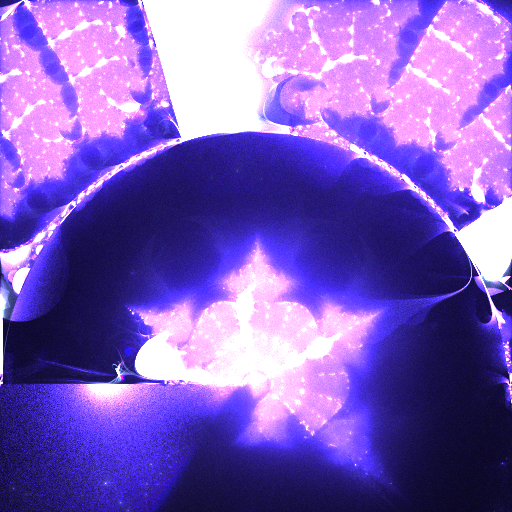
The above image is from Wikipedia.1 The result looks like this:
Refresher on the Mandelbrot set
I'll assume the reader knows what the Mandelbrot set is. The mathematical formulation of the basic Mandelbrot set is as follows:
- Start with a complex number
cequal to a normalized image coordinate and a complex numberzequal to0. - Iterate a few hundred times the equation
z = z^p + cwherepis the exponent. - If the magnitude of
zexceeds2, the pointcis not in the Mandelbrot set. - Color the point on the image we took
cfrom black if it is in the Mandelbrot set, and white if it is not.
This is fairly simple to implement in Rust with the png crate for writing images and rayon for parallelizing the main image creation loop:
use File;
use BufWriter;
use Path;
use *;
As you can see, this code hardcodes the complex square function and uses 100 iterations to determine if a point is in the Mandelbrot set. The result is as follows:

Adding the complex power is a bit more tricky. There are no primitives for complex exponentiation, so here is a simple derivation of the formula for for :
In plain words, we replace complex exponentiation with complex multiplication (rotation) of a complex logarithm. Code snippet that implements this modification for :
//...
// z^i + c = e^(i ln z) + c
let mut distance = .sqrt.ln;
let mut angle = b.atan2;
= ;
= ;
let distance = distance.exp;
let = ;
= ;
= ;
// ...
However, simply plugging this into the Mandelbrot renderer will not work. To see the issue, think about what a and b are at the start of the loop and what operations are done to them:
// ...
let mut a = 0.0;
let mut b = 0.0;
// ...
let mut distance = .sqrt.ln;
// = (0 + 0).sqrt().ln() = (0).ln() = very bad thing
Put simply, this code will create NaN values and will likely create a pure black or white image. I tried some things like clipping the square root to a minimum value, but it only recovered some of the pixels.
Of all places, I found the solution to this issue in TikTok. A video by Dylan Woodbrey shows an implementation of the complex exponent Mandelbrot set in Desmos along with a link to the formula. I looked through the math to see where I went wrong and realized the Desmos implementation used a slightly different definition for the Mandelbrot set:
- Start with a complex number
cequal to a normalized image coordinate and a complex numberzequal tothat is the same as0c. - Iterate a few hundred times the equation
z = z^p + cwherepis the exponent. - If the magnitude of
zexceeds2, the pointcis not in the Mandelbrot set. - Color the point on the image we took
cfrom black if it is in the Mandelbrot set, and white if it is not.
In other words, the starting coordinate sidesteps the numerical issue entirely by starting the iteration from the point we are testing. The change in the code is simple:
// let mut a = 0.0;
// let mut b = 0.0;
let mut a: f64 = x;
let mut b: f64 = y;
// ...
This is mathematically equivalent to assuming the first complex exponentiation produced a zero and we simply added the coordinate to it.
Following this change, the code produces the following image:
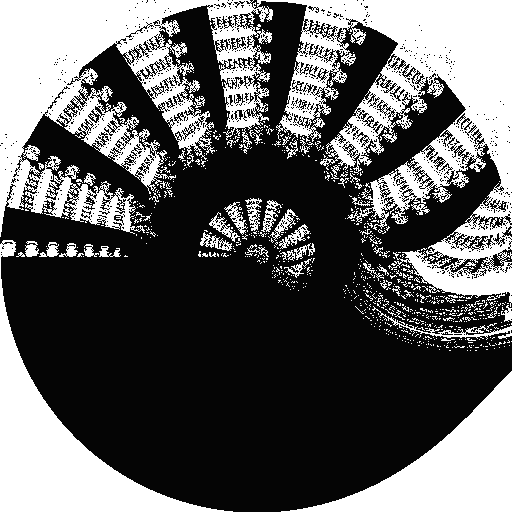
We can see the interesting grid-like structure from the video, but the image is black-and white, which makes it kind of boring. This means it's time to add the Mandelbuddha histogram counting.
- Start with a complex number
cequal to a normalized image coordinate and a complex numberzthat is the same asc - Iterate a few hundred times the equation
z = z^p + cwherepis the exponent. - If the magnitude of
zexceeds2, the pointcis not in the Mandelbrot set. Color the point on the image we tookIf the point escaped, record all points on it and make them slightly more bright on the image.cfrom black if it is in the Mandelbrot set, and white if it is not.
The current architecture assumes the color for all pixels is independent of each other and can be computed from just the coordinate. This is not the case for the Mandelbuddha, as a pixel can be colored from any point that has a trajectory passing through it. What we can do instead is sample N randomly positioned points, run the Mandelbrot iteration on them, and record the trajectory of each point that escapes in an atomic histogram:
let mut atomic_pixels: = .map.collect;
.into_par_iter.for_each;
This can create real Mandelbuddha images, albeit black-and-white:
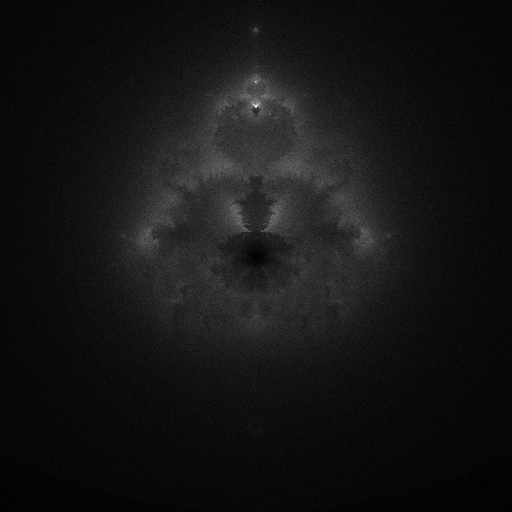
I did a bit of tweaking to find an exponent I liked:
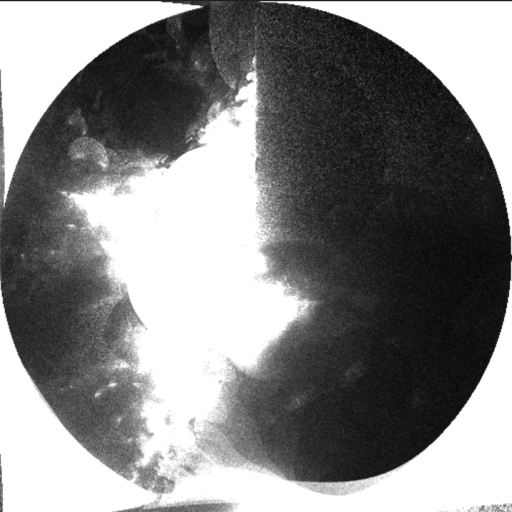
The image is grainy, like path tracing renders or a low-resolution photo. I like the look, but the same technique could produce smoother renders like the one on Wikipedia.
Adding color is simple: some channels will have lower cutoffs for the number of iterations and some will have higher, with the same array of recorded points used for all channels.
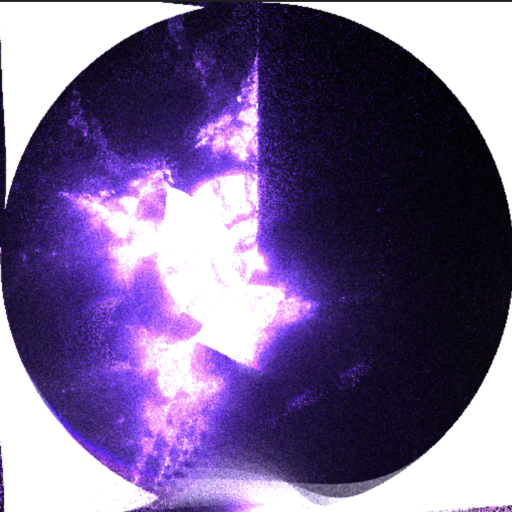
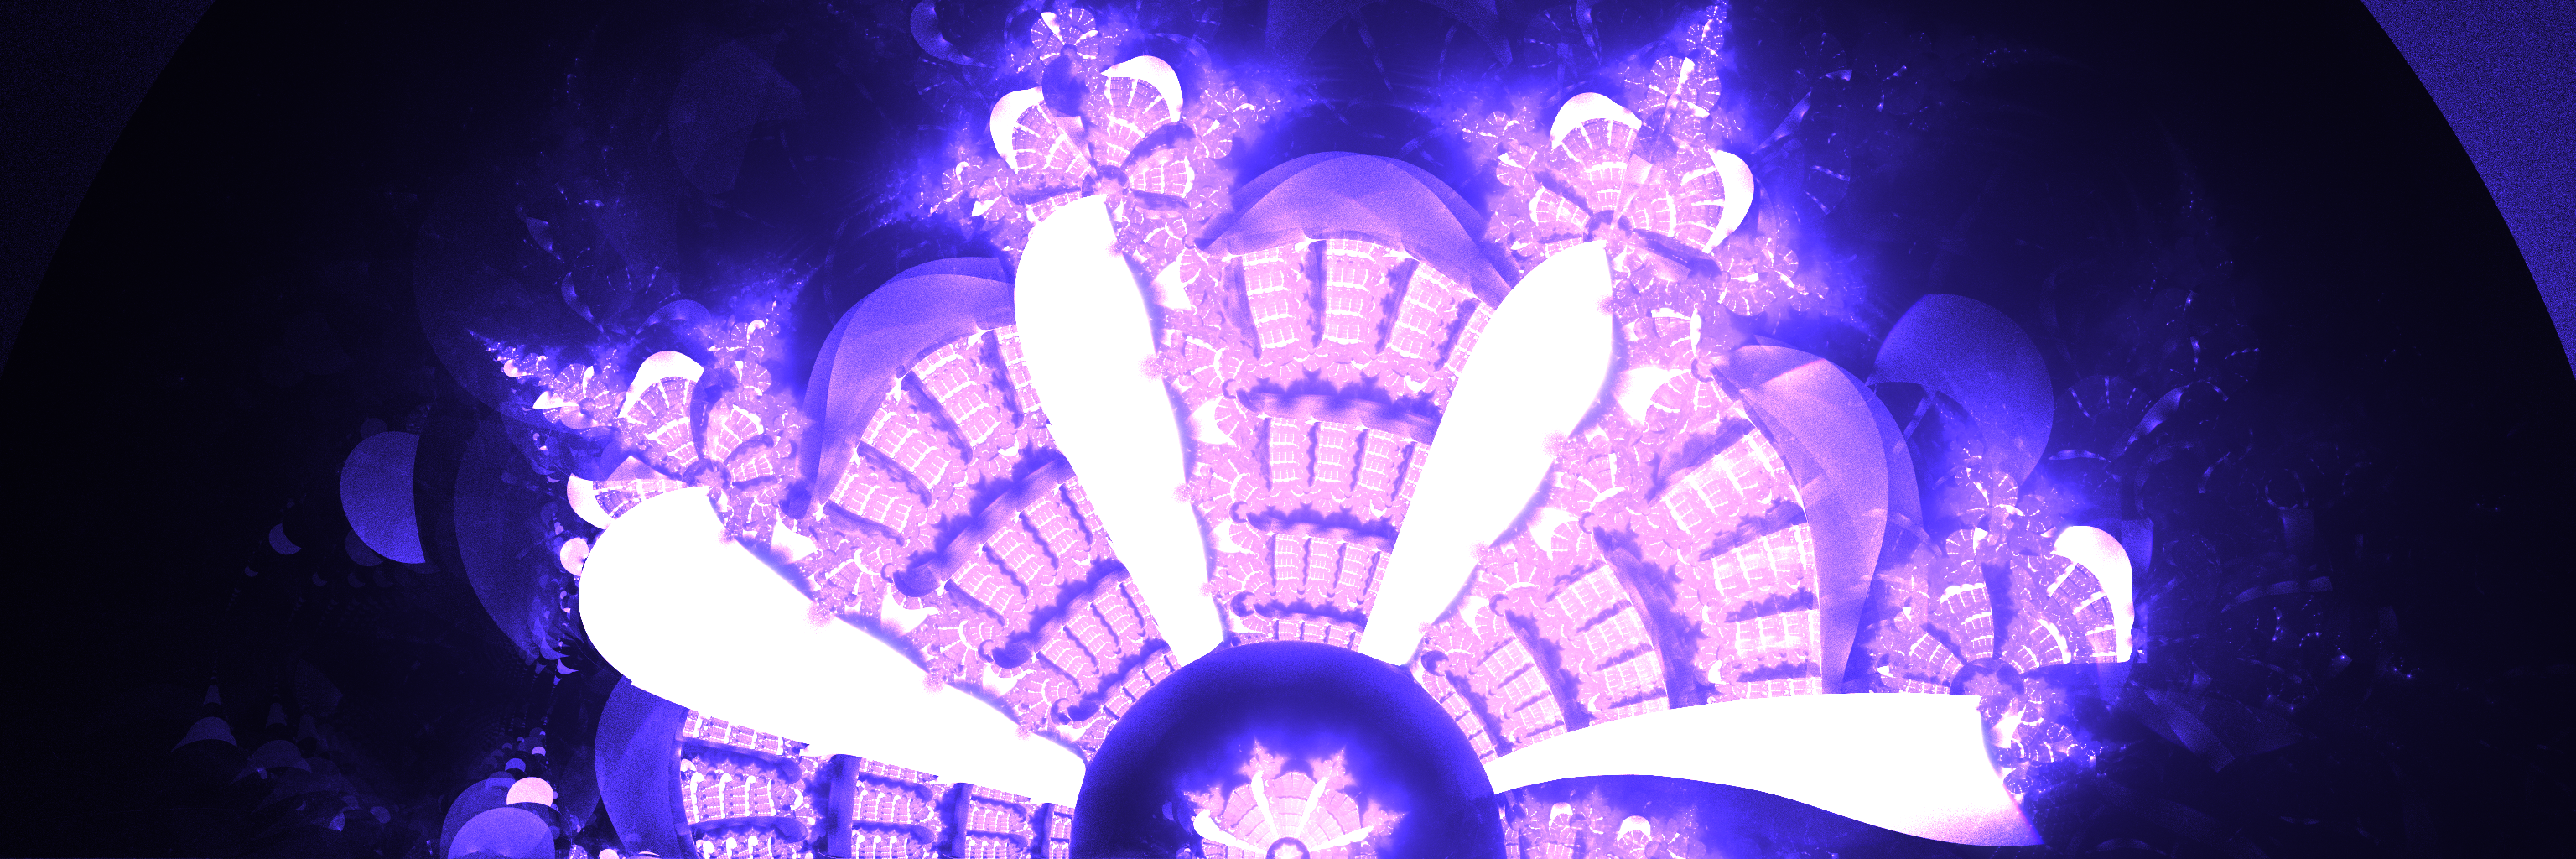
At this point, I added some features like better color normalization2 and cropping of the resulting images. I put an image from mandelbub on the main page of the website and generated this wallpaper:
Mostly taking into account the fact that the scaling of the number of trajectory steps that visit any given pixel is proportional to the number of points we sample and the number of iterations and inversely proportional to the total number of pixels in the image.